
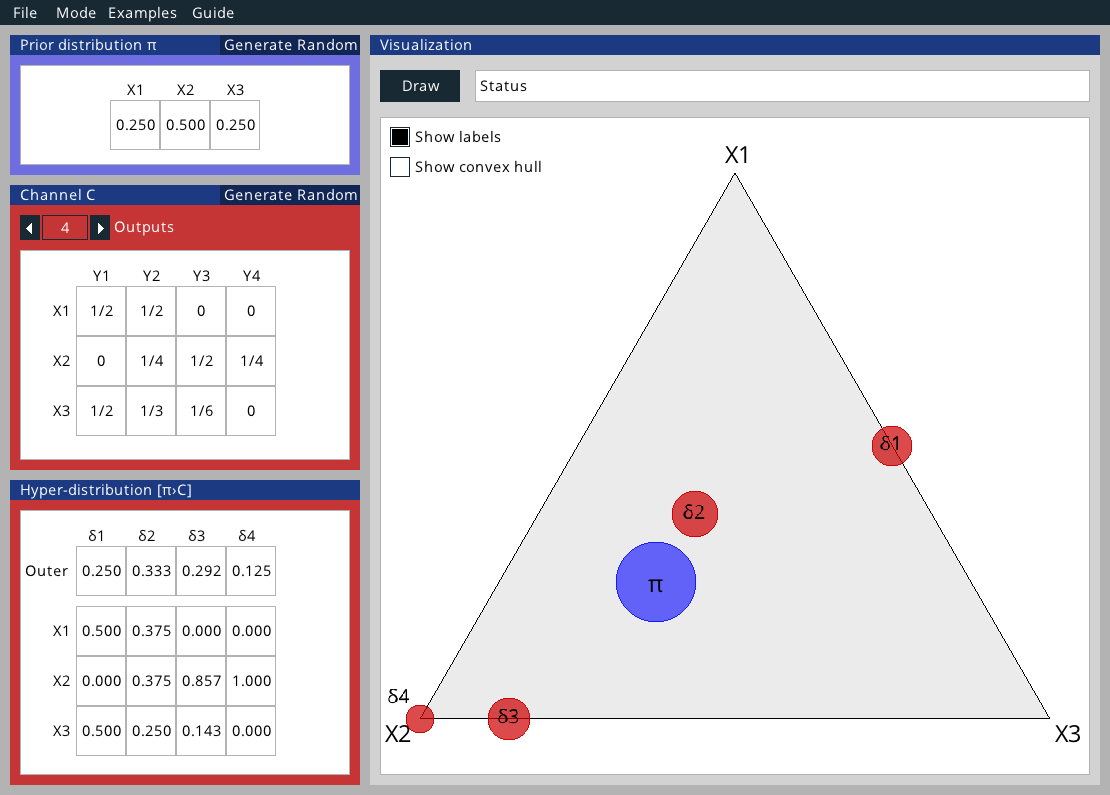
QIF Graphics: A visualization tool for Quantitative Information Flow (QIF)
Graphical tool for representing the Quantitative Information Flow (QIF) among a set of three secrets. Developed in C/C++ all the graphic structures were made using raylib library and emscripten to compile the project do .js and WebAssembly.
The tool is can be accessed via web browser here.
Repository: https://github.com/ramongonze/qif-graphics.
References
[1] Alvim M.S; Chatzikokolakis K; McIver A; Morgan C; Palamidessi C; Smith G.S. The Science of Quantitative Information Flow. Springer, 1 edition, 2019.
[2] Raylib. A simple and easy-to-use library to enjoy videogames programming. Available at https://raylib.com. Accessed in 01/18/2019.
[3] Emscripten. A toolchain for compiling to asm.js and WebAssembly, built using LLVM, that lets you run C and C++ on the web at near-native speed without plugins. Available at https://emscripten.org. Accessed in 01/18/2019.